 © Ed Hawkins, University of Reading")
Show your stripes 2024: a darker shade of red
by Kirsty McCabe, FRMetS
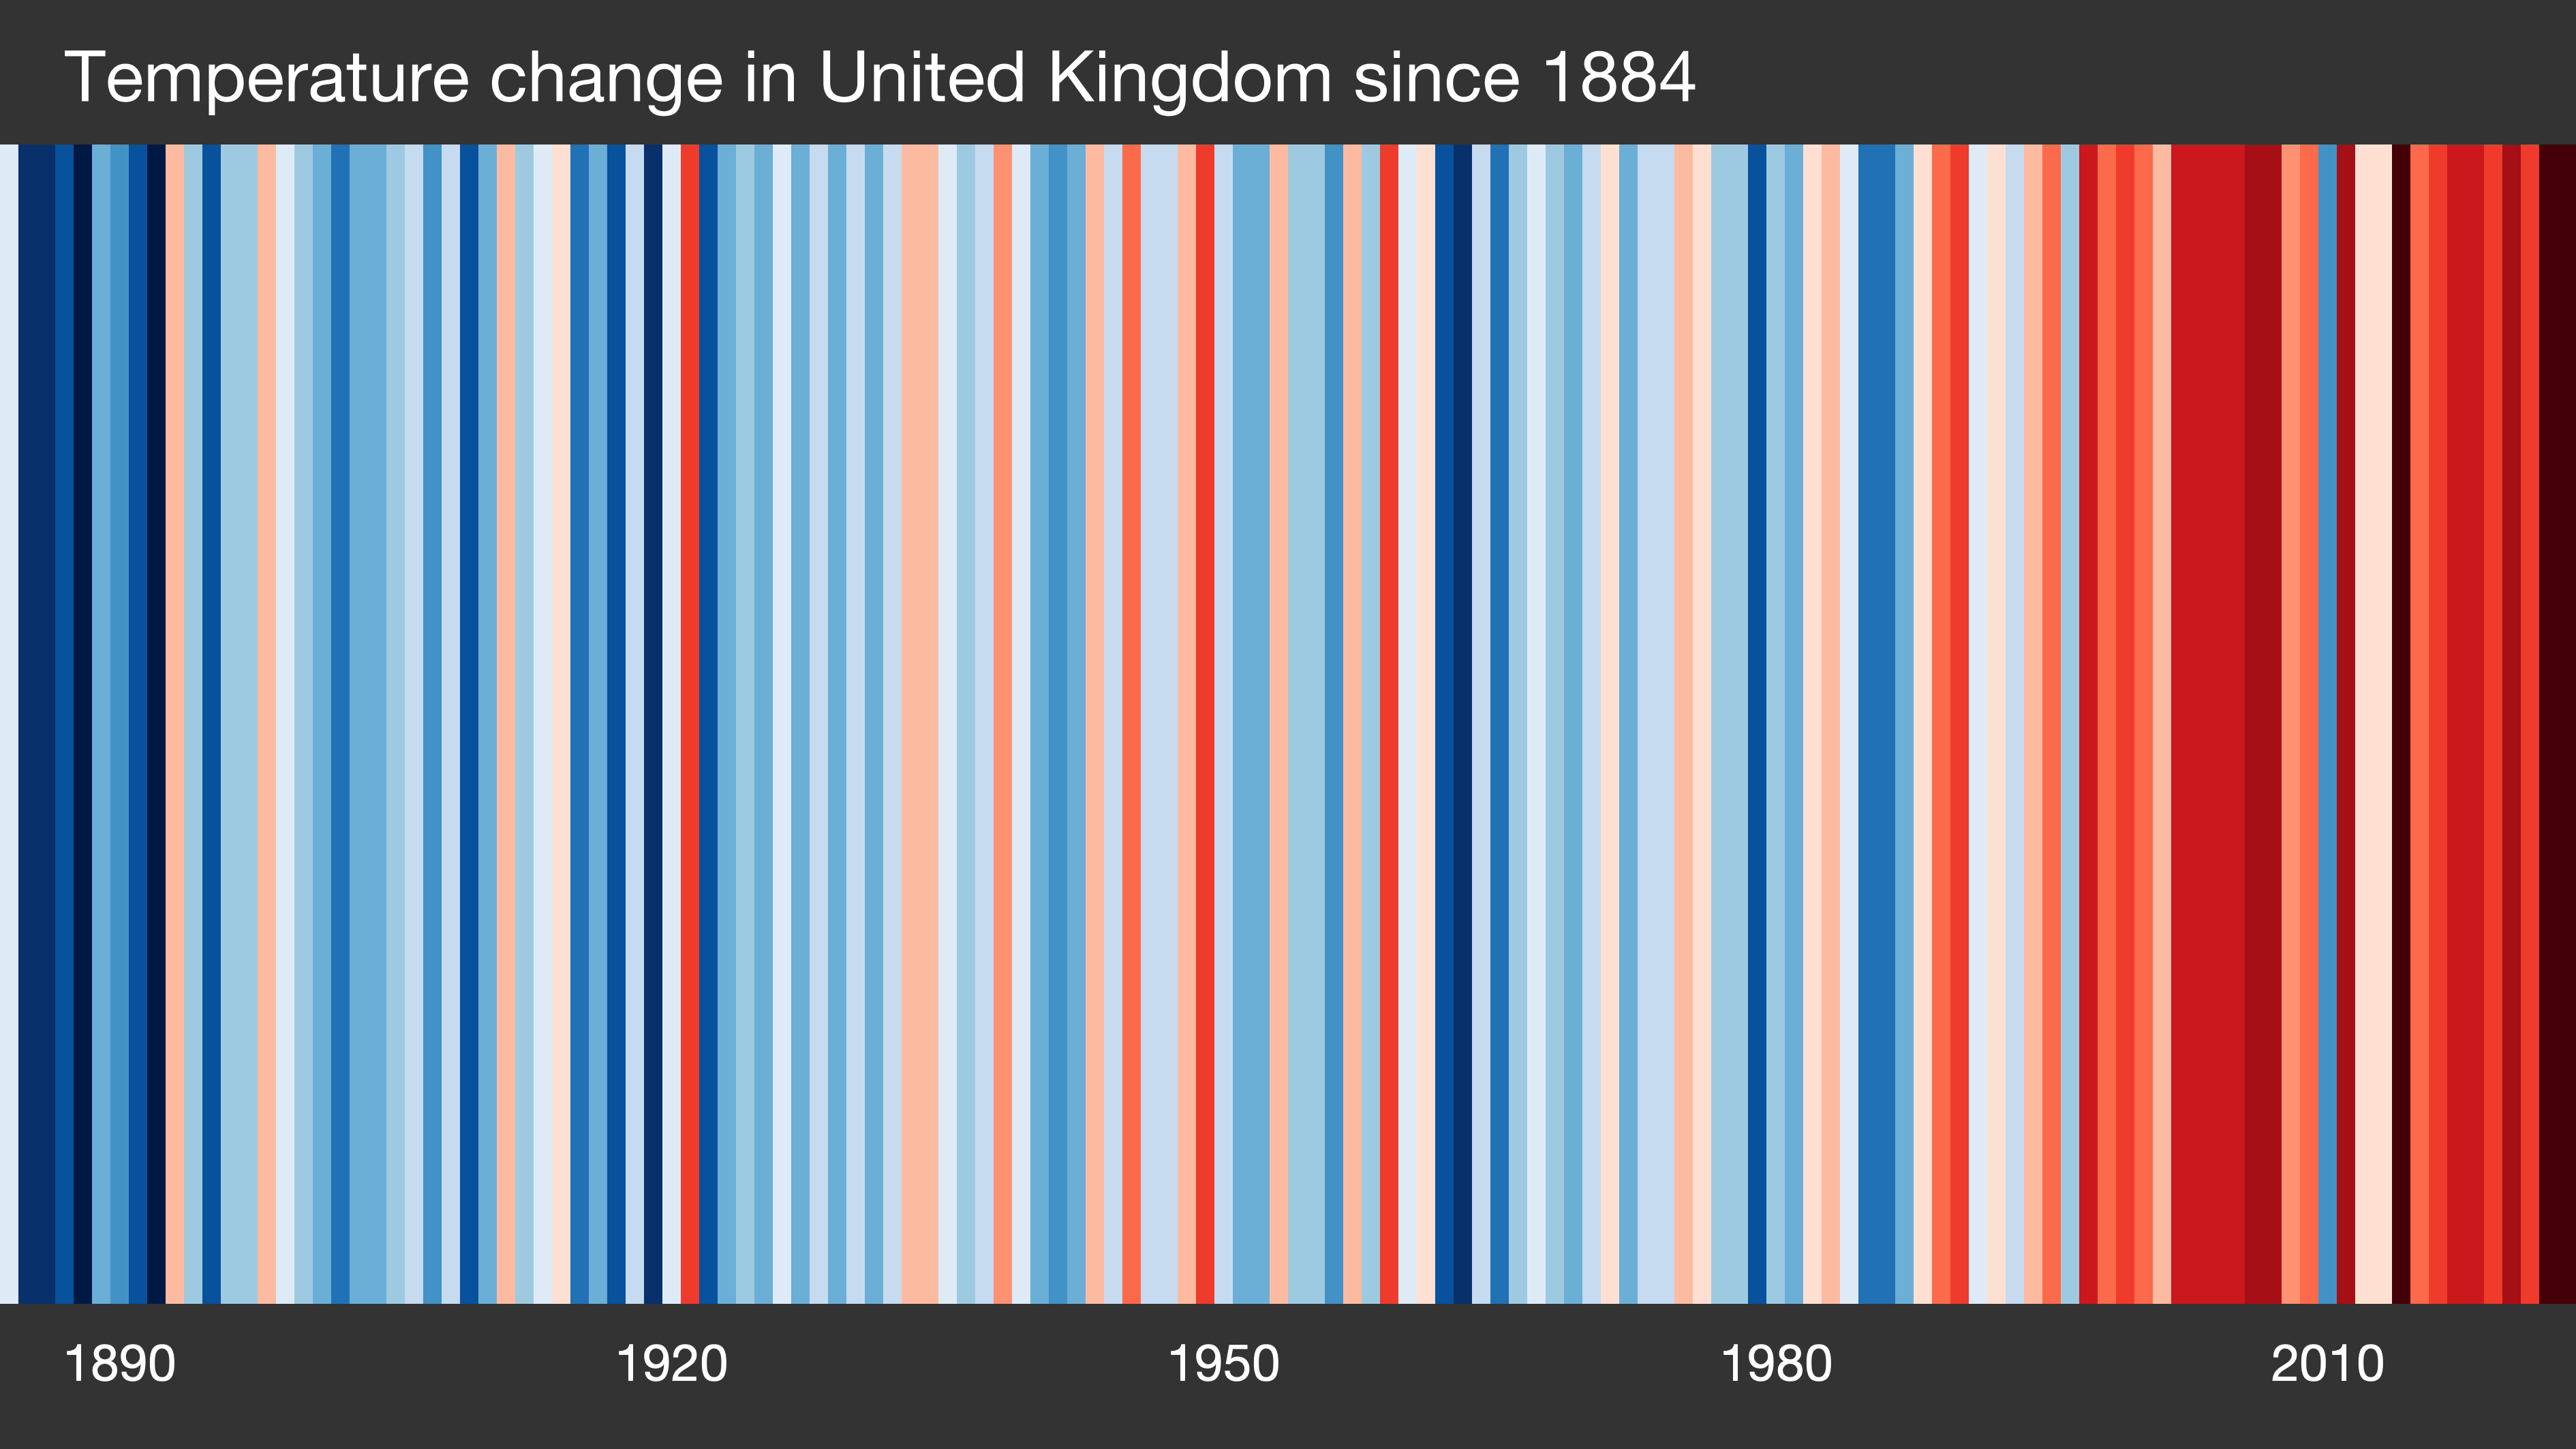
Since their creation in 2018, the 'warming stripes' created by Climate Scientist and Society Fellow, Professor Ed Hawkins (University of Reading) have become an iconic and brilliant way to communicate climate change.

Ed's simple striking visualisation doesn’t need words or numbers, it is simply a series of vertical coloured bars that shows the change in average annual temperatures since 1850. Each bar, or stripe, represents the temperature in a city, country or continent averaged over a year. Red stripes indicate hotter years, and the blue stripes show cooler years, against the average of the period 1961-2010.
For virtually every country, region or city, the stripes turn from mainly blue to mainly red in recent decades, illustrating the rapid rise in average temperatures.
But after 2023’s extreme heat, the global climate stripes for 2023 were so red-hot they were off the scale, requiring a new darker shade of red. While Ed was aware that this was likely to happen in the future, he wasn’t expecting it quite so soon.
“This was always going to happen at some point, given the continued increase in global greenhouse gases, and is in line with what scientists have been predicting for decades. But the margin of record breaking in 2023 has still been a surprise.”
— Prof Ed Hawkins
Each year, 21 June marks #ShowYourStripes day. Meteorologists and scientists around the world share the warming stripes to start conversations about climate change, promote awareness of the climate crisis, and stress the urgent need to take action now.
London shows its stripes
To announce #ShowYourStripes Day, the climate stripes illuminated the iconic BT Tower overnight, providing a beacon on the London skyline that shone a light on the progressive heating of our planet.
Get involved: https://t.co/XLWlkvsnB4 pic.twitter.com/LFzb1gKDA1— Uni of Reading (@UniofReading) June 21, 2024
So look out for the stripes on landmarks, buildings and monuments around the world, or download the images (all updated using 2023 data) and use #ShowYourStripes on social media to share the stripes for your city or country on 21 June.
It’s time to #showyourstripes!
Weather presenters from around the world at the #FIMC2024 media workshop in Darmstadt. Thanks@eumetsat for hosting us. pic.twitter.com/4H1F0zPTlT— Kirsty McCabe FRMetS (@kirstymccabe) June 21, 2024


